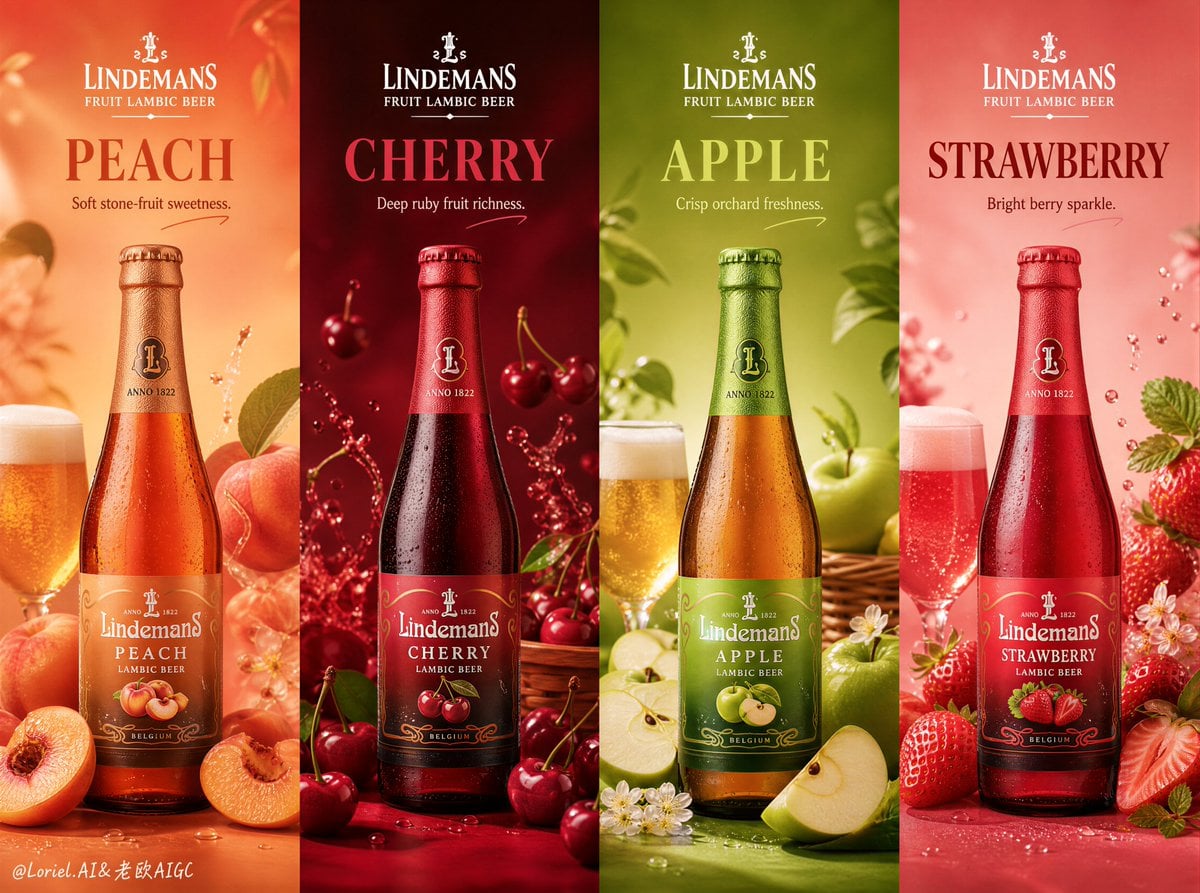
![2x2 grid, AI picks subjecs: INPUT ::= [Product] + [Proof ...](https://cdn.guidesref.com/trk_6a830eb81b1c58.28675602.jpg)
2x2 grid, AI picks subjecs: INPUT ::= [Product] + [Proof ...
Prompt
2x2 grid, AI picks subjecs: INPUT ::= [Product] + [Proof Point Or Number]
STEP_1 :: interpret the proof
identify what the number actually means in human terms: duration, quantity, speed, savings, strength, coverage, capacity, efficiency
determine the simplest physical unit viewers can recognize without reading a chart
STEP_2 :: convert data into matter
represent the proof using real objects, distance, volume, height, repetition, accumulation, or spatial scale
every visible unit should correspond logically to the underlying claim
avoid abstract bars, graphs, percentages, and digital dashboards
STEP_3 :: place the product
position the product beside, within, supporting, producing, or overcoming the physicalized data
product provides immediate scale reference
relationship between claim and product must remain visually obvious
STEP_4 :: create credibility
introduce natural irregularity: imperfect stacking, compression, gaps, shadows, weight, material deformation
show evidence that the enormous quantity physically exists in the scene
use people or architecture only when needed for scale
STEP_5 :: render spec
large-format campaign photography
extreme clarity and dimensional depth
data should be understandable before reading any accompanying copy
forbidden: infographic overlays, impossible duplication artifacts, mathematically meaningless repetition, perfectly cloned objects, fake-looking crowds
Copy PromptCopied!


![TITLE: [Title]](https://cdn.guidesref.com/trk_6a9e54a98cb030.73818010.jpg)