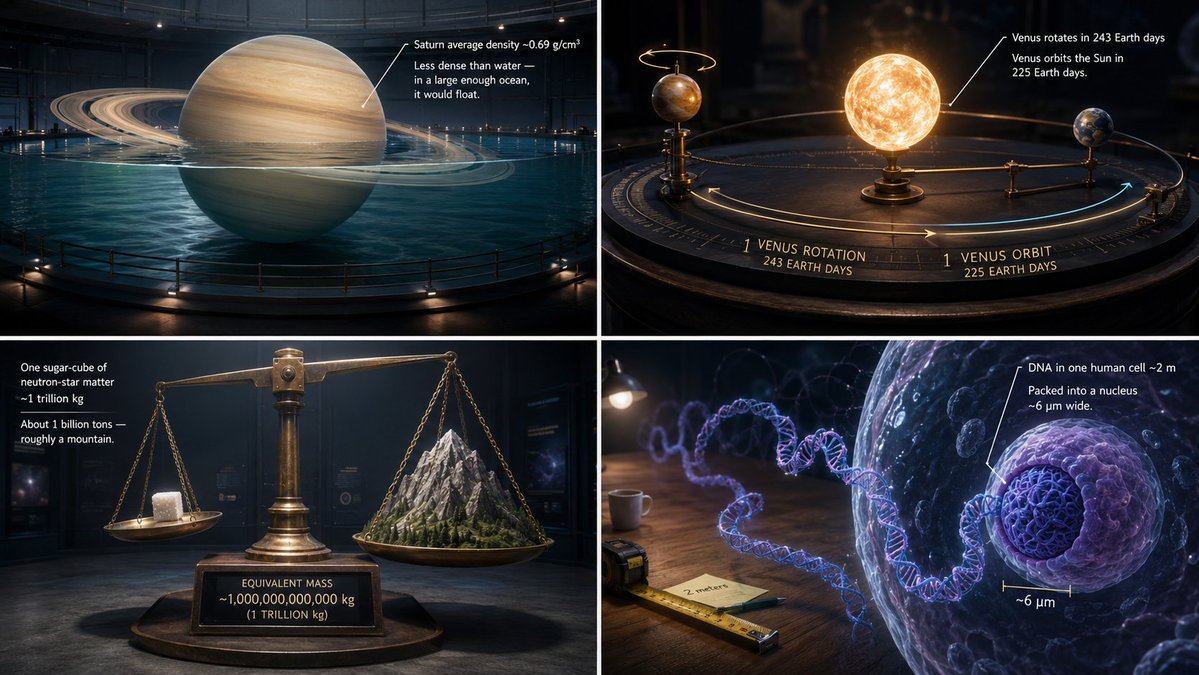
Scientific Data Visualization Grid
Prompt
2x2 grid, 16:9, 4 mind-bending science facts input = [[Subject] / [Fact Or Stat] / [Reference Medium] / [Data Mode]] run science_fact_visualization_extraction: subject_dna := infer what subject is, its scale, material, shape, and recognizable visual identity fact_type := infer whether the fact is density, size, mass, speed, heat, pressure, distance, probability, lifespan, energy, scarcity, cost, or another measurable category measured_value := use provided value or verified value; if illustrative, clearly mark as illustrative reference_comparison := infer what the value is being compared against visual_metaphor := infer the most intuitive physical demonstration of the fact environment := infer scene that makes the comparison visible physical_interaction := infer floating, sinking, stretching, melting, compressing, orbiting, stacking, shrinking, overflowing, balancing, glowing, freezing, or other behavior callout_text := generate concise explanatory label leader_line := connect label to the exact visual evidence camera := infer cinematic educational framing lighting := infer clean, beautiful, credible science-documentary lighting render: a cinematic visual explanation where the fact is embodied by the subject’s interaction with the reference medium. forbidden: hard-coded planet, hard-coded water, hard-coded density value, hard-coded text box, unsupported physics, fake precision without data, purely decorative infographic text.
Copy PromptCopied!educationalTechnicalCinematic Lightingstudio lightinggrid layoutSymmetricalother